


washington post
Nine black church congregants were killed by a white shooter last night in Charleston, S.C., a shocking event that local police are characterizing as a hate crime. Below are several pieces of critical context on hate crimes and hate groups from the Southern Poverty Law Center, the FBI and other sources. While the number of active hate groups in the U.S. has fallen in recent years, the hate crime rate remains steady and blacks remain the racial group most likely to experience racially-motivated violence.
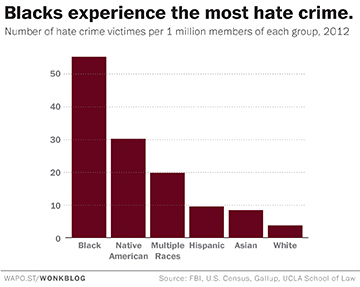
1. Among racial groups, blacks experience the most hate crime.
FBI hate crime data show that more than 50 out of every 1 million black citizens was the victim of a racially-motivated hate crime in 2012, the highest among any racial group.
But this is almost certainly an undercount. The FBI is reliant on state and local law enforcement agencies to categorize and report hate crimes correctly. Some agencies do a much better job of this than others, and there is general agreement that the FBI numbers are significantly lower than they should be.
2. Hate crime rates have remained stable over the past decade
The Bureau of Justice Statistics provides the most comprehensive overall count of hate crime incidents. Their data, drawn from interviews with victims, shows the number of hate crimes occurring has remained fairly constant over the past 10 years, hovering between 200,000 and 300,000 annually.
3. The number of active hate groups has fallen in recent years.
According to the Southern Poverty Law Center, the number of active hate groups, which it defines as “groups have beliefs or practices that attack or malign an entire class of people, typically for their immutable characteristics,” more than doubled from 457 in 1999 to 1018 in 2011.
Since then the number of active groups has declined to 784. The SPLC attributes this to various causes — including an improving economy and recent law enforcement crackdowns, as well as widespread internecine squabbling and splintering within the groups themselves.
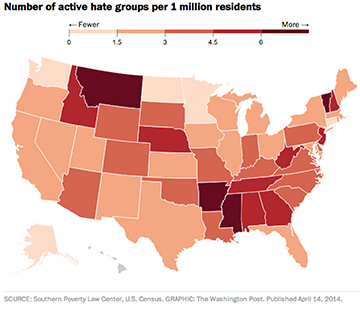
4. Hate groups are most concentrated in the Deep South, Northern Plains
Hate groups aren’t distributed evenly by geography. Controlling for the population in each state, hate groups are concentrated most in the Deep South and in the Montana/Idaho region.
Vermont and New Hampshire also stand out on this map. Partially, this is a function of low population — Vermont has fewer than 700,000 residents, which combined with its four active hate groups gives it a high per-capita value. But this may not just be an artifact of low population. Researchers at Humboldt State University recently mapped geocoded tweets containing hate speech, and their map does appear to show a high incidence of hate-tweets originating in Vermont.
5. Hardship breeds hatred
Researchers have tried to suss out the causes of hate crime over the years. A 2002 review of hate crime literature by Princeton economist Alan Krueger looked at the economic determinants of hate crime — whether these crimes rose and fell in response to economic conditions like poverty rate and unemployment. Krueger concludes that “rather than economic conditions, the hate crimes literature points to a breakdown in law enforcement and official sanctioning and encouragement of civil disobedience as significant causes of the occurrence of hate crimes.”
Not so fast, say economists Matt Ryan and Peter Leeson. In 2010 they examined the links between hate groups and hate crime in the United States. Perhaps surprisingly, they find no relationship between the number of hate groups in a state, and the number of hate crimes that occur within that state in a given year. Instead, the primary determinants seem to be economic. “Our results suggest that unemployment and, to a lesser extent, poverty, are strongly associated with more hate crime, particularly crimes that are sexually, racially and religiously motivated,” they conclude.
The most recent SPLC data on hate groups also seems to show a relationship between active hate groups and economic conditions in a state. The chart below plots number of active KKK chapters against the percentage of state residents living in poverty, and shows a positive relationship between the two. This fits with an analysis Richard Florida did a few years back in the Atlantic, where he found that the prevalence of hate groups corresponds with various political and economic factors.


Leave a Comment